Section 2
Types of functions
Frequently used functions in economics are:
Linear function: Each term contains at most one variable, and the exponent of the variable is \(1\).
$$f(x)=a+bx$$
Here, \(b\) is the slope of the function, and \(a\) is the vertical intercept.
Quadratic function: $$f(x) = ax^{2} + bx + c \qquad \color{red}{(a \neq 0)}$$
Polynomial function of degree n: $$f(x) = a_{0} + a_{1}x + a_{2}x^{2} + \cdots + a_{n}x^{n}$$
Here, \(a_{1}, \cdots , a_{n}\) are coefficients.
(Quick question: Can \(a_{n}\) be zero if the function is a polynomial function of degree n?)
Rational function:
$$f(x) = \frac{g(x)}{h(x)} \qquad\qquad \color{red}{(g(x) \neq 0, \;\; h(x) \neq 0)}$$
Other commonly used functions in economics are the natural exponential functions and natural logarithmic functions etc. (Please see a recommended book to learn more about exponential and logarithmic functions.)
Examples of functions
\(y = 10\) is a constant function.
\(y = 2 + x\) is a linear function.
\(y = x^{2}, \quad y = 2x^{2} - 2x + 10\) are examples of quadratic functions.
\(y = x^{3} + 2x^{2} - 2x + 10\) is an example of a cubic function or a polynomial function of degree three.
\(y = \frac{x + 2}{x - 2}\) is an example of a rational function.
\(y = 2xe^{x}\) is an exponential function.
\(y = \ln \; x\) is a logarithmic function.
For more examples, please see a recommended book.
Sketching the graph of a function
When we draw the graph of a function, we generally place the independent variable on the horizontal axis and the dependent variable on the vertical axis. If we have two variables in a function, one is the dependent variable, another is the independent variable, for example, \(y=f(x)\), we can sketch the graph using two dimensions or axis in the Cartesian plane with coordinates \((x,y)\). All points on the graph of \(y=f(x)\) satisfy the equation \(y=f(x)\).
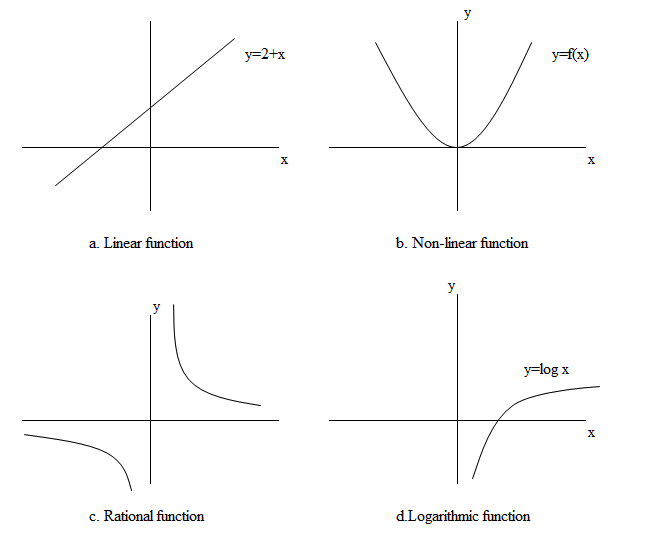
While during the exam writing your name and student number are important to identify you, it’s also important to indicate each axis using the corresponding variable to identify the function. In Figure 2 we present the graphs of some commonly used functions. Try to find two common mistakes that are present in these graphs.
Figure 2

UWO Economics Math Resources by Mohammed Iftekher Hossain is licensed under a Creative Commons Attribution-NonCommercial-ShareAlike 4.0 International License.